
- Origins of Technical Analysis: The First Market Speculators
- Dow Theory: How a Journalist Accidentally Created Technical Analysis
- Robert Rhea: Turning Dow Theory into a Trading Playbook
- Early 20th-Century Pioneers: Wyckoff, Gann, and the Evolution of Market Tactics
- Ralph Nelson Elliott and the Cult of the Wave
- Evolution of Charting Techniques and Indicators
- Technical Analysis: Science, Superstition, or Something in Between?
- The Evolution of Technical Analysis in Modern Markets
- The Unchanging Game: Why Technical Analysis Still Matters
Technical analysis, the craft (or pseudoscience, depending on your level of scepticism), of predicting price movements by studying charts has been around for centuries. Long before traders had multiple screens and algorithmic models, market observers were already spotting patterns and making speculative bets. The tools may have evolved, but the core idea remains unchanged: human behaviour is predictable, and so are the markets it drives.

This whirlwind tour through the history of technical analysis traces its roots from the 17th-century pioneers who first noticed price tendencies, through the legendary figures who formalised charting techniques, to the present-day landscape, where machine learning and high-frequency trading have transformed pattern recognition into an arms race. Along the way, we’ll examine its triumphs, controversies, and why, despite relentless criticism from academic purists, technical analysis refuses to fade into irrelevance. Whether you swear by trendlines or dismiss them as financial astrology, understanding the evolution of this discipline offers a fascinating insight into how traders, markets, and technology have shaped each other over the centuries.
Origins of Technical Analysis: The First Market Speculators

Long before financial TV and high-frequency trading, early market speculators were on the hunt for patterns — because where there’s money, there’s an edge to be found. The roots of technical analysis stretch all the way back to 17th-century Amsterdam, home to one of the world’s first official stock markets. Traders there noticed that prices didn’t move randomly; patterns emerged, and those who understood them had an edge.
Joseph de la Vega and the Dutch Stock Market
One of the first to put these ideas into words was Joseph de la Vega, whose 1688 book Confusion of Confusions chronicled the speculative frenzy of the Dutch stock market. His observations on price fluctuations, investor psychology, and market manipulation were remarkably ahead of their time — early hints of what would later evolve into technical analysis.
Munehisa Homma and the Birth of Candlestick Charting

Meanwhile, over in Japan a century later, Munehisa Homma was refining technical analysis into something far more structured. A rice trader in the early 1700s, Homma wasn’t just watching prices, he was meticulously documenting them. He developed the now-famous candlestick charting technique, tracking daily price movements as visual bars and identifying patterns that reflected shifts in trader sentiment. His 1755 book, The Fountain of Gold, laid out these methods, arguing that markets are driven by emotions as much as supply and demand, a concept that still underpins modern technical analysis.
How Early Technical Pioneers Shaped Market Thinking
Homma’s success was so legendary that stories claim he made 100 consecutive winning trades, a feat so outrageous that the Japanese government took notice and awarded him samurai status for his financial prowess. Whether or not the legend is fully true, his work became the foundation of many technical analysis concepts still in use today.
These early pioneers, from de la Vega to Homma, weren’t just speculators, they were the first to recognise that markets, for all their supposed efficiency, have recurring patterns and behavioural cycles. By studying price action and volume, they uncovered a simple but enduring truth: markets evolve, but human nature doesn’t, which is why technical analysis remains just as relevant today.
Dow Theory: How a Journalist Accidentally Created Technical Analysis
Before technical analysis became a multi-billion-dollar industry of charts, algorithms, and traders glued to their screens, it was just a handful of people trying to make sense of market behaviour. And at the centre of it all was Charles Dow, a financial journalist who never set out to create a trading strategy but ended up laying the groundwork for one of the most influential theories in financial history.
Dow’s ideas weren’t flashy. There were no intricate indicators or complex models, just a fundamental belief that markets move in trends and price reflects all available information. What started as a simple observation evolved into Dow Theory, the bedrock of modern technical analysis.
But he wasn’t alone. After his death, his followers refined and expanded on his ideas, transforming them from scattered insights into a structured trading methodology. Here’s how it all unfolded.
Charles Dow: The Journalist Who Spotted Market Trends

In the 1890s, Dow began meticulously tracking stock movements, compiling what would become the Dow Jones Industrial Average. By studying the highs and lows of these averages over daily, weekly, and monthly timeframes, he noticed that markets weren’t just chaotic noise. Instead, they followed recognisable trends, long-term uptrends and downtrends, with smaller fluctuations rippling through like waves against a larger tide.
Dow’s observations weren’t just fleeting insights. Over time, they took shape into a broader framework that traders would later refine and formalise.
The Birth of Dow Theory
Dow never got around to formalising his observations into a grand theory — perhaps because monetising ideas wasn’t as fashionable back then, or maybe because he was too busy actually watching the market. Instead, he published his insights in a series of editorials in The Wall Street Journal, arguing that all known information is already reflected in prices and that by studying market movements, one could gauge its true direction. This collection of ideas, later dubbed Dow Theory, became the foundation for modern technical analysis.
Dow’s death in 1902 didn’t mark the end of his ideas. If anything, his followers took them further, refining and expanding what would become a structured trading framework.
As Dow’s ideas gained traction, another group of market thinkers was taking things further, not just identifying trends, but dissecting market structure itself. Enter Richard Wyckoff, William Gann, and the early 20th-century pioneers who turned technical analysis from broad market observations into a strategic discipline.
William P. Hamilton: Refining the Rules of Trend Confirmation

But while Dow had laid the groundwork, it was his successors who transformed these ideas into something traders could actually use.
William P. Hamilton, Dow’s successor at The Wall Street Journal, refined Dow Theory in the 1920s, introducing rules for confirming trends, most notably, the idea that both industrial and transportation averages must move in tandem to validate a bull or bear market.
Hamilton wasn’t just a market analyst; he was a poet at heart. To him, the market wasn’t just numbers, it was an ocean. Tides dictated the major trends, waves were intermediate movements, and daily fluctuations were nothing more than ripples. Romantic? Definitely. But it worked, his market calls were eerily precise, successfully predicting multiple market turns.
Robert Rhea: Turning Dow Theory into a Trading Playbook

And then there was Robert Rhea, the man who finally turned Dow Theory into a structured trading system.
In the 1930s, Rhea took Dow’s principles mainstream with The Dow Theory (1932), distilling them into actionable trading signals — when to go long, when to go short, and when to sit tight.
His newsletter, using Dow’s framework, called the 1932 market bottom and the 1937 top, moves that reportedly made his subscribers a fortune. For the first time, Dow Theory wasn’t just a collection of observations, it was a system traders could use to make real money.
The Lasting Influence of Dow Theory
By the mid-20th century, Dow Theory had cemented itself as a cornerstone of market analysis. The core idea — that price trends and patterns reveal future direction — remains embedded in technical analysis today.
Traders might not always think about Dow Theory when analysing moving averages, but whether they realise it or not, they’re still following the logic of a journalist who just wanted to make sense of stock prices and accidentally laid the foundation for technical analysis as we know it.
Not bad for a guy who never wrote a trading manual.
Early 20th-Century Pioneers: Wyckoff, Gann, and the Evolution of Market Tactics
The early 20th century wasn’t just a time of roaring industry and economic expansion, it was also when traders began to crack the code of price movements, laying the foundations for what we now call technical analysis. The markets were still a lawless frontier, but a handful of sharp minds saw patterns where others saw chaos.
Richard Wyckoff: The Architect of Market Structure
One of the most influential was Richard D. Wyckoff, a trader and market theorist who spent the 1910s – 1930s meticulously studying how big players— what he called “smart money”— moved in and out of markets. His Wyckoff Method dissected price action into four repeating phases:

- Accumulation – Institutions quietly build positions.
- Markup – Momentum kicks in, and prices rally.
- Distribution – Big players offload to the unsuspecting masses.
- Markdown – The inevitable downturn.
If retail traders were playing checkers, Wyckoff was playing 4D chess.
His technique, rooted in tape reading — the old-school skill of analysing price and volume without fancy indicators — became a cornerstone of market analysis. Through The Magazine of Wall Street and his correspondence courses, he laid down trading principles that still hold weight today. His work on support, resistance, and market cycles continues to shape how traders interpret price action, proving that some things never change, only the tools do.
William Gann: The Market Mystic
While Wyckoff focused on decoding market structure and trader psychology, William D. Gann took a radically different approach — one that still divides opinion today. If Wyckoff was the methodical scientist, Gann was the mystic. He believed markets weren’t just driven by supply and demand but by geometric patterns and time cycles, claiming that price movements followed mathematical precision. His most famous tool, Gann Angles, attempted to predict future price movements using a web of geometric slopes — an approach that still influences some traders today, particularly in forecasting trend lines and support/resistance levels. Though Gann’s work often veered into esoteric territory, elements of his methods remain in use, particularly in time-based market analysis.

But Gann didn’t stop at geometry, he brought astrology and planetary cycles into the mix, arguing that celestial movements influenced market behaviour. To sceptics, this was pure pseudoscience, yet to his followers, it was an early attempt at quantifying market cycles. His Master Charts, filled with circles, squares, and hexagons are still analysed by traders searching for hidden order in price movements. While some dismiss his work as mysticism, others argue that his projections align eerily well with market cycles — if you know how to interpret them.
Jesse Livermore: The Intuitive Speculator
Meanwhile, some of the greatest traders of the era weren’t formal theorists but still shaped technical analysis. Jesse Livermore, possibly the most infamous speculator of his time, relied on pure price action and momentum, making (and losing) multiple fortunes by trading on instinct and tape-reading mastery.

He never wrote a technical manual, but his dramatic wins and losses, immortalised in Reminiscences of a Stock Operator, made him a legend. His aggressive, momentum-driven approach laid the groundwork for modern breakout traders, and even some algorithmic strategies designed to exploit price swings.
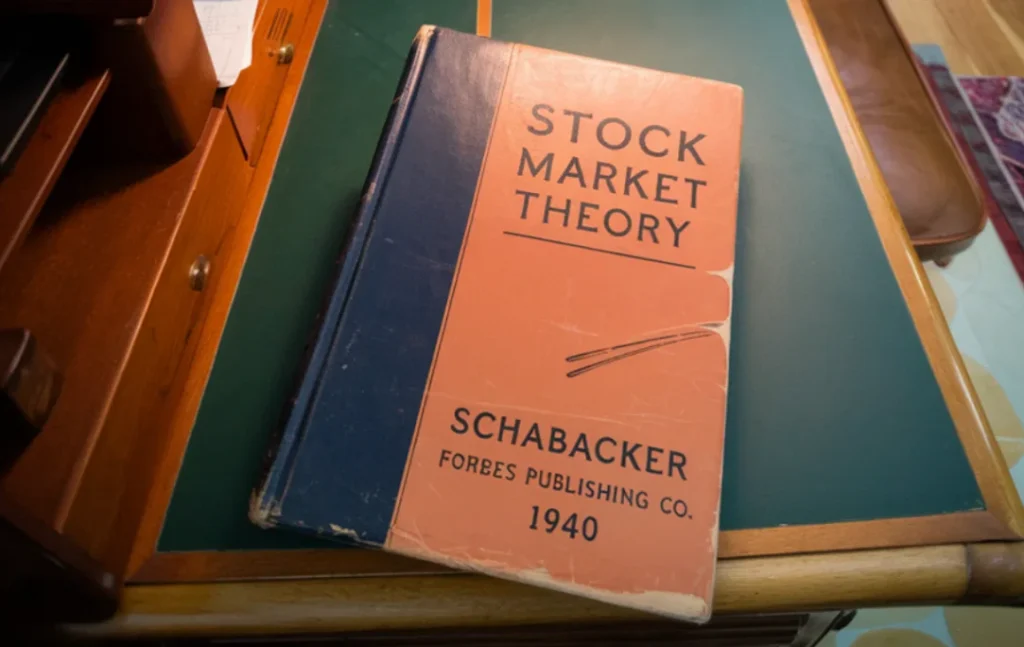
Richard Schabacker: The First Technical Analysis Textbook
Richard W. Schabacker took a more systematic approach, building on the foundations of Dow Theory. His 1932 book, Technical Analysis and Stock Market Profits, formalised many of the chart patterns and trend principles traders still use today. While Livermore embodied the fast-paced, high-stakes nature of speculation, Schabacker focused on structuring technical analysis into a methodical framework — something traders could study and apply with discipline.
By the 1930s, technical analysis had evolved from instinct-driven speculation to a more structured discipline. Dow’s trend principles, Wyckoff’s market cycles, Gann’s geometric projections, and Schabacker’s systematic charting approach were all shaping how traders interpreted price movements. What had once been an art form practised by a handful of market operators was now transforming into a formalised approach, though, as always, its legitimacy remained a topic of debate.
Ralph Nelson Elliott and the Cult of the Wave
In the depths of the Great Depression, when markets resembled a financial wasteland and economists were throwing darts at charts, an unlikely figure emerged with a theory that would forever divide technical analysts. Ralph Nelson Elliott, an accountant by trade and a market obsessive by inclination, spent his convalescence in the 1930s doing what any rational person would — meticulously poring over decades of stock market data in search of order amid the chaos.

What he uncovered wasn’t just a pattern but a grand, almost mystical framework for market behaviour: the Elliott Wave Principle. The core idea? Markets don’t lurch randomly in a drunken stupor; they move in recurring, structured waves dictated by crowd psychology. According to Elliott, bull runs unfold in a five-wave sequence: three strong pushes upward (Waves 1, 3, and 5), each separated by a corrective pullback (Waves 2 and 4). Corrections typically follow a three-wave ABC pattern. These structures repeat across different timeframes, forming a self-similar fractal pattern within market cycles. Essentially, the market was a giant, self-replicating organism of human emotion, oscillating between greed and fear with near-mathematical precision.
A Stunning Prediction That Changed Everything
Elliott wasn’t just theorising from an ivory tower. In 1935, he sent a now-famous telegram calling a stock market bottom one day before the Dow Jones Industrial Average turned and began a two-year rally. That kind of prescience earned him followers, many of whom would later swear by his methods with near-religious conviction. By the 1970s, Robert Prechter had weaponised Elliott Waves to predict the 1980s bull market and, later, the infamous 1987 crash. Suddenly, the Wave Theory wasn’t just an intellectual curiosity; it was market prophecy.
The Problem With Seeing Patterns Everywhere

Of course, not everyone bought in. Even within the technical analysis world, Elliott’s work was divisive. Critics argued that wave counting was highly subjective, leading to wildly different interpretations. One analyst might predict a rally, while another expects a crash, all from the same chart. The theory’s flexibility made it intriguing but also hard to disprove. As one sceptic put it, Elliott Wave analysis often feels like ‘mysticism piled on top of numbers.’
A Theory That Refuses to Die
And yet, despite (or perhaps because of) it’s almost cult-like status, Elliott Wave Theory endures. It remains a cornerstone of technical analysis, particularly for those drawn to big-picture, long-term market cycles. Love it or loathe it, Elliott’s work continues to influence traders who see patterns where others see noise, and who believe the market’s next move isn’t chaos, but inevitability.
Evolution of Charting Techniques and Indicators
Technical analysis didn’t emerge overnight. It evolved over decades, shaped by traders who refined techniques, introduced new indicators, and embraced technology. From hand-drawn charts to algorithmic models, the discipline has transformed dramatically, blending art and science to decode market behaviour.
The Birth of Modern Charting
By the mid-20th century, technical analysis had matured into a structured discipline. A defining moment came in 1948 with the publication of Technical Analysis of Stock Trends by Robert D. Edwards and John Magee. Their work systematically catalogued classic chart patterns — head-and-shoulders, double bottoms, triangles — and formalised trend analysis techniques. For generations of traders, this became the definitive guide to charting.
Building on Dow Theory, Edwards and Magee refined the practice of recognising and trading recurring price formations. Their research reinforced the idea that careful chart analysis — still done by hand in those days — could provide meaningful, actionable insights. Before computers made complex calculations feasible, technical analysis was an almost entirely visual discipline.

Around this time, point-and-figure charting — a technique that maps price movements without considering time, also gained popularity. Interestingly, Charles Dow himself had experimented with a version of this decades earlier, though it wasn’t until later that it became widely adopted
From Patterns to Numbers: The Rise of Indicators
By the 1950s, technical analysis was evolving beyond the realm of pure pattern recognition. The days of traders squinting at hand-drawn charts and relying on gut instinct were giving way to something more structured, quantitative indicators that transformed technical analysis into a numbers game.
One of the earliest pioneers, Richard Donchian, introduced the idea of moving average based trading rules in the late 1940s. His Donchian Channels, which track the highest highs and lowest lows over a set period, offered a systematic approach to trend-following — a stark contrast to the more discretionary methods of the past.

Then came the Stochastic oscillator, developed by George Lane in 1950. Designed to measure a closing price relative to its recent range, it gave traders an objective way to gauge overbought and oversold conditions — a useful tool for those looking to time entries rather than simply ride trends.
The following decades saw an explosion of technical indicators, many of which remain cornerstones of modern trading. J. Welles Wilder’s Relative Strength Index (RSI), introduced in 1978, became the go-to momentum oscillator. Around the same time, Gerald Appel developed the Moving Average Convergence Divergence (MACD) — a blend of trend-following and momentum analysis that quickly gained traction. Meanwhile, Joe Granville’s On-Balance Volume (OBV), launched in 1963, was among the first to integrate price movement with volume data, giving traders an early glimpse into potential shifts in market sentiment.
Between the 1960s and 1980s, indicators of every shape and size — trend averages, oscillators, breadth measures — proliferated, thanks in large part to advances in programmable calculators and early computers. This wasn’t just a technical evolution; it was a cultural shift. By the time the Market Technicians Association was founded in 1973, technical analysis had moved from the fringes of financial markets to something approaching mainstream acceptance.
The Digital Revolution: Charting Goes High-Tech

By the late 20th century, technical analysis had undergone a full-blown transformation. What was once a manual, almost artistic practice became increasingly systematic. The rise of computers didn’t just speed up charting, it changed how traders approached the market altogether. Suddenly, strategies could be tested, optimised, and automated. The days of painstakingly hand-drawing trendlines on graph paper were over; computers had taken over, ushering in a new era of visualisation and algorithmic precision.
Candlestick charts, once an esoteric Japanese technique, broke into the Western trading scene in the 1980s and 90s, largely thanks to Steve Nison’s 1991 book on the subject. Suddenly, traders worldwide were embracing these visually rich price-action tools, realising they offered far more than just a pretty alternative to bar charts.

At the same time, personal computers and charting software were revolutionising market analysis. Early platforms like MetaStock and TradeStation gave traders the ability to plot intricate charts and layer indicators at the click of a button — a stark contrast to the manual calculations and hand-drawn figures of previous decades. Fast forward to today, and charting platforms are ubiquitous, highly customisable, and powered by real-time data, making advanced technical analysis more accessible than ever.
Technical Analysis Becomes Mainstream
This digital leap didn’t just make things faster, it solidified technical analysis as a core trading discipline. Dow Theory’s trend concepts, classic chart pattern analysis, and the explosion of technical indicators all converged into a comprehensive framework, giving traders the freedom to mix and match strategies to suit their market approach. What was once a niche, somewhat arcane practice had become a mainstream methodology, applied across stocks, commodities, and currencies worldwide.
Technical Analysis: Science, Superstition, or Something in Between?
For all its widespread use, technical analysis has spent decades in the academic crosshairs, dismissed by critics as little more than financial astrology. Supporters swear by it, while sceptics argue it’s an illusion, patterns that only exist because enough people believe in them. So, does technical analysis hold real value, or is it just another trading superstition?
The Academic Backlash: Astrology for Traders?
The Efficient Market Hypothesis (EMH), formalised by Eugene Fama in 1970, argues that markets instantly absorb all available information, meaning past price movements hold no predictive power. Princeton’s Burton Malkiel doubled down on this idea, famously comparing chart reading to astrology. His argument? Any patterns traders claim to spot are either pure coincidence or disappear the moment they become widely known.

The Subjectivity Problem: Seeing What You Want to See
Show two traders the same chart, and one sees a textbook reversal pattern while the other sees meaningless noise. If a prediction fails, there’s always a convenient excuse — the timeframe was off, the pattern wasn’t fully formed, or another indicator contradicted it. This flexibility makes technical analysis difficult to disprove, edging it into pseudoscience territory. And then there’s selection bias: successful calls get broadcast everywhere, while bad ones are quietly forgotten, creating an illusion of reliability.
Divisive Methods: Science or Mysticism?
Even within the discipline, some methods have been controversial. Elliott Wave analysis, for example, is often criticised for its complexity and open-ended interpretations. Some early pioneers of technical analysis built near-messianic followings, complete with bold but unverifiable claims of market mastery, adding to the field’s fringe reputation.
The Case for Technical Analysis: Psychology in Action
Yet, defenders argue that traditional finance theory ignores reality. Markets aren’t run by rational automatons but by humans — emotional, impulsive, and prone to herd mentality. Behavioural finance, once dismissed, now supports the idea that psychology drives price action, reinforcing patterns traders can exploit. The momentum effect, where strong performers tend to keep rising, also challenges the idea that prices move randomly.
Folklore or a Legitimate Tool?
The debate isn’t going anywhere. Critics see technical analysis as a glorified superstition, useful at best as a trading heuristic. But as long as traders believe in it, markets will continue to reflect its influence, whether through self-fulfilling prophecy or something more.
The Evolution of Technical Analysis in Modern Markets
Technical analysis has come a long way from its early days of hand-drawn charts and manual calculations. Today, it’s not just a tool for retail traders, it’s a core component of algorithmic trading, quantitative finance, and even cryptocurrency markets. While the technology has advanced, the underlying principles remain the same: price action reflects market psychology, and patterns can provide an edge.
From Human Chartists to High-Frequency Trading
Despite decades of scepticism, technical analysis hasn’t faded into irrelevance, it has evolved. What traders once did with pencils and graph paper, hedge funds and investment banks now execute at lightning speed using high-frequency trading (HFT) algorithms. These systems dominate daily market volume, using moving averages, volatility breakouts, and relative strength indicators to make trades in milliseconds.
The Rise of Algorithmic and Quantitative Trading

The fusion of big data, machine learning, and technical analysis has changed the game. Modern algorithmic trading systems backtest strategies on decades of market data, fine-tuning parameters and identifying inefficiencies that no human trader could spot. Hedge funds and quants don’t just use pre-existing technical indicators, they develop their own, hunting for subtle price patterns that algorithms, not humans, can detect.
Technical Analysis in Crypto and Alternative Markets
Unlike stocks, which have earnings reports and economic data to analyse, cryptocurrencies lack traditional fundamentals. This has made technical analysis the dominant approach in crypto trading. Bitcoin, Ethereum, and altcoins are dissected using the same chart patterns and indicators applied to stocks and forex, as traders look for patterns in price action to navigate volatile moves. Meanwhile, in traditional finance, momentum and trend-following strategies (deeply rooted in technical thinking) are widely used by managed futures funds and commodity trading advisors (CTAs). Even academia has been forced to acknowledge the momentum factor as a key driver of asset returns.
The Retail Revolution: Trading for Everyone

Modern charting platforms have made technical analysis more accessible than ever. What once required hours of manual work can now be done in seconds with interactive software, algorithmic alerts, and automated execution tools. A retail trader today can track dozens of indicators, scan for breakout patterns, and automate trades — a level of sophistication once reserved for institutions.
New Tools, Same Core Principles
For all the technological advancements, the essence of technical analysis hasn’t changed. Whether it’s Dow, Wyckoff, or an AI-driven quant fund, the principle remains the same: observe market behaviour, identify patterns, and act accordingly. The tools may have evolved, but the logic that underpins technical trading still holds firm.
The Unchanging Game: Why Technical Analysis Still Matters
Technical analysis has survived centuries of scrutiny, dismissed by sceptics as financial superstition and embraced by traders as a market cheat code. Yet, for all the technological leaps—high-speed data, machine learning, algorithmic trading — the essence of it remains unchanged. Markets are still driven by human nature, and human nature is nothing if not predictable. Fear, greed, euphoria, panic, they all leave patterns in the price action, just as they always have.
Will the future of technical analysis be dominated by AI-powered hedge funds running hyper-optimised models, or will there always be room for lone traders sketching trendlines on a chart? Perhaps both. But one thing is certain: recognising patterns before the rest of the market has always been the key to an edge — and that much hasn’t changed.


